


Is EUR/NZD in for a major trend reversal soon?
I’m seeing a head and shoulders pattern on the 4-hour chart, with price currently testing the neckline support.
Better not miss a potential breakdown if it happens!
EUR/NZD: 4-hour
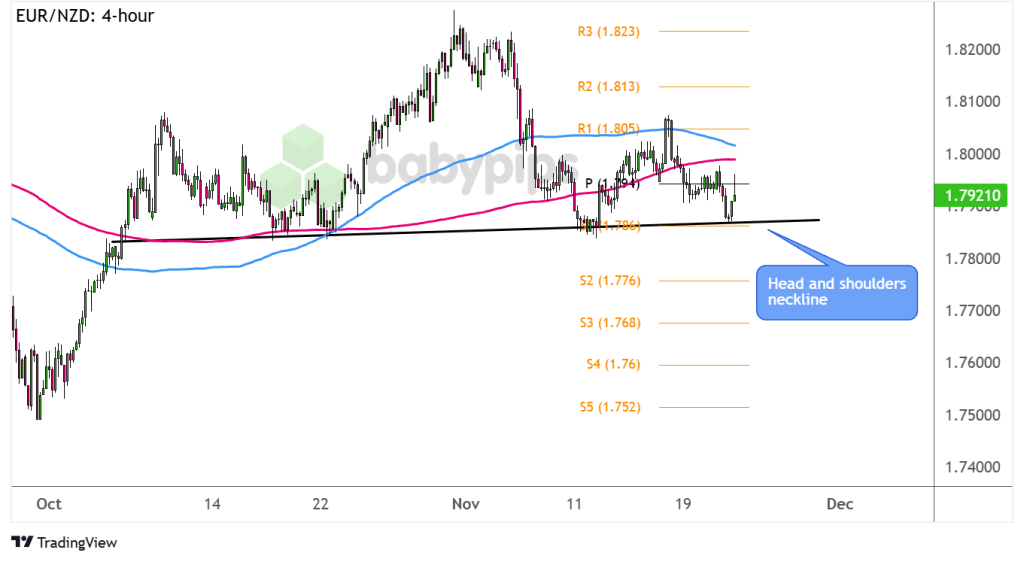
Dovish ECB rhetoric has been dragging the shared currency lower against most of its counterparts over the past few weeks, bringing EUR/NZD down to test its head and shoulders neckline support.
However, risk aversion stemming from the Russia-Ukraine conflict has also kept the higher-yielding Kiwi’s gains in check.
Can the upcoming eurozone PMI releases turn the spotlight back to economic catalysts? Remember that directional biases and volatility conditions in market price are typically driven by fundamentals.
Expectations are for slight improvements in the region’s manufacturing and services sector, but downbeat results could highlight the possibility of another ECB rate cut next month.
If that’s the case, look out for a break below the neckline support at S1 (1.7860) and a possible selloff that’s the same height as the chart pattern, which spans roughly 300 pips.
If support keeps holding, on the other hand, EUR/NZD could set its sights back on near-term resistance zones, including the area of interest at R1 (1.8050) then R2 (1.8130).
Note that the 100 SMA is above the 200 SMA for now to reflect bullish pressure but that the gap between the indicators is narrowing to hint at a potential bearish crossover.
Conclusion
EUR/NZD is currently testing the neckline support of a head and shoulders pattern on the 4-hour chart, signaling a potential trend reversal.
The shared currency has been under pressure due to dovish rhetoric from the ECB and concerns over potential rate cuts, while risk aversion from the Russia-Ukraine conflict has limited the Kiwi’s gains.
The upcoming eurozone PMI releases could play a pivotal role, with weaker-than-expected data possibly triggering a breakdown below 1.7860 and a subsequent 300-pip selloff.
Conversely, if support holds, the pair could target resistance levels at 1.8050 and 1.8130. Meanwhile, technical indicators suggest bearish momentum may develop as the gap between the 100 SMA and 200 SMA narrows.


